Soal 1.6.

1.6. Diketahui: Sampel acak :

20◦C: 2.07 2.14 2.22 2.03 2.21 2.03 2.05 2.18 2.09 2.14 2.11 2.02

45◦C: 2.52   2.15 2.49 2.03 2.37 2.05  1.99 2.42 2.08 2.42 2.29  2.01

Ditanya:

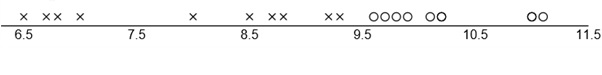
  1. Gambarkan letak titik-titik datanya dengan dengan temperatur terendah dan tertinggi
  2. Hitung mean dari sampel
  3. Apakah tampak seolah-olah suhu pengaman memiliki pengaruh pada kekuatan tarik bedasarkan data? Jelaskan
  4. Apakah sesuatu yang muncul berpengaruh terhadap bertambahnya kenaikan suhu? Jelaskan

JAWABAN

A

1)

PLOT3

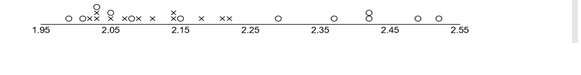
‘o’ melambangkan suhu 20 derajat celcius, ‘x’ melambangkan suhu 45 derajat celcius

2) Mean : 20 derajat celcius : 2.07 + 2.14 + 2.22 + 2.03 + 2.21 + 2.03 + 2.05 + 2.18 + 2.09 + 2.14 + 2.11 + 2.02 / 12 = 2.1075

Mean : 45 derajat celcius : 2.52 + 2.15 + 2.49 + 2.03 + 2.37 + 2.05 + 1.99 + 2.42 + 2.08 + 2.42 2.29 + 2.01 / 12 = 2.2350

3) Berdasarkan plot, dapat dilihat bahwa temperatur tinggi memberikan nilai lebih tinggi kekuatan tariknya, bersama dengan beberapa nilai kekuatan nilai kekuatan tarik rendah. Secara keseluruhan temperatur mempengaruhi kekuatan tariknya.

4) Tampaknya juga perubahan kekuatan tarik semakin besar ketika temperatur suhu meningkat


Soal 1.5.

1.5 Twenty adult males between the ages of 30 and
40 participated in a study to evaluate the effect of a
specific health regimen involving diet and exercise on
the blood cholesterol. Ten were randomly selected to
be a control group, and ten others were assigned to
take part in the regimen as the treatment group for a
period of 6 months. The following data show the reduction
in cholesterol experienced for the time period
for the 20 subjects:
Control group: 7 3 −4 14 2
5 22 −7 9 5
Treatment group: −6 5 9 4 4
12 37 5 3 3
(a) Do a dot plot of the data for both groups on the
same graph.
(b) Compute the mean, median, and 10% trimmed
mean for both groups.
(c) Explain why the difference in means suggests one
conclusion about the effect of the regimen, while
the difference in medians or trimmed means suggests
a different conclusion.

JAWABAN

1.5

(a)  Control group: 7 3 −4 14 25 22 −7 95

Treatment group: −6 5 9 4412 37 5 3 3

(b) Control: ¯x = 5.60, ˜x = 5.00, ¯xtr(10) = 5.13.

Treatment: ¯x = 7.60, ˜x = 4.50, ¯xtr(10) =  5.63.

(c) The extreme value of 37 in the treatment group plays a strong leverage role for the mean calculation.

Soal 1.4.

1.4 Diketahui: Sample acak:

Company A: 9.3  8.8  6.8  8.7  8.5  6.7  8.0  6.5  9.2  7.0

Company B: 11.0  9.8  9.9  10.2  10.1  9.7  11.0  11.1  10.2  9.6

Ditanya: a. Mean dan median dari kedua data tersebut? b. Tempatkan data dari company a dan company b, dan berikan pendapat dimana perbedaan dari kedua data company tersebut

Jawab: a. Mean: company a: 9.3 + 8.8 + 6.8 + 8.7 + 8.5 + 6.7 + 8.0 + 6.5 + 9.2 + 7.0 / 10 = 7.950

Mean: company b: 11.0+9.8+9.9+10.2+10.1+9.7+11.0+11.1+10.2+ 9.6 / 10 = 10.260

Median: company a: 6.5  6.7  6.8  7.0  8.0  8.5  8.7  8.8  9.2  9.3  = 8.250

Median: company b: 9.6  9.7  9.8  9.9  10.1  10.2  11.0  11.0  11.1 = 10.15

b. Tempatkan data dari company a dan company b, dan berikan pendapat dimana perbedaan dari kedua data company tersebut

PLOT2

Dari data ‘X’ melambangkan company a, dan ‘o’ melambangkan company b. Dari data tersebut dapat dilihat data b lebih fleksibel

Soal 1.3.

1.3 A certain polymer is used for evacuation systems
for aircraft. It is important that the polymer be resistant
to the aging process. Twenty specimens of the
polymer were used in an experiment. Ten were assigned
randomly to be exposed to an accelerated batch
aging process that involved exposure to high temperatures
for 10 days. Measurements of tensile strength of
the specimens were made, and the following data were
recorded on tensile strength in psi:
No aging: 227 222 218 217 225
218 216 229 228 221
Aging: 219 214 215 211 209
218 203 204 201 205
(a) Do a dot plot of the data.
(b) From your plot, does it appear as if the aging process
has had an effect on the tensile strength of this polymer? Explain.
(c) Calculate the sample mean tensile strength of the
two samples.
(d) Calculate the median for both. Discuss the similarity
or lack of similarity between the mean and
median of each group.

JAWABAN

1.3

(a) No aging: 227 222 218 217 225

218 216 229 228 221

Aging: 219 214 215 211

209218 203 204 201 205

(b) Yes, the aging process has reduced the ten￾sile strength.

(c) ¯xAging = 209.90, ¯xNo aging = 222.10

(d) ˜xAging = 210.00, ˜xNo aging = 221.50. The means and medians are similar for each group.

Soal 1.1.

1.1 The following measurements were recorded for
the drying time, in hours, of a certain brand of latex
paint.
3.4 2.5 4.8 2.9 3.6
2.8 3.3 5.6 3.7 2.8
4.4 4.0 5.2 3.0 4.8
Assume that the measurements are a simple random
sample.
(a) What is the sample size for the above sample?
(b) Calculate the sample mean for these data.
(c) Calculate the sample median.
(d) Plot the data by way of a dot plot.
(e) Compute the 20% trimmed mean for the above
data set.
(f) Is the sample mean for these data more or less descriptive
as a center of location than the trimmed
mean?

JAWABAN

(a) Sample size = 15

(b) Sample mean = 3.787

(c) Sample median = 3.6

(e) ¯xtr(20) = 3.678

(f) They are about the same.


under construction

Probabilistik Statistik, Soal 1.2.

Referensi:

Probability & Statistics

for Engineers & Scientists

Ronald E. Walpole

Roanoke College

Raymond H. Myers

Virginia Tech

Sharon L. Myers

Radford University

Keying Ye

University of Texas at San Antonio

Prentice Hall

CONTOH SOAL

1.2 According to the journal Chemical Engineering, an important property of a fiber is its water absorbency. A random sample of 20 pieces of cotton fiber was taken and the absorbency on each piece was measured. The following are the absorbency values:

18.71     21.41     20.72    21.81    19.29     22.43    20.17

23.71    19.44      20.50    18.92    20.33    23.00    22.85

19.25     21.77     22.11    19.77     18.04    21.12

(a) Calculate the sample mean and median for the above sample values.

(b) Compute the 10% trimmed mean.

(c) Do a dot plot of the absorbency data.

(d) Using only the values of the mean, median, and trimmed mean, do you have evidence of outliers in the data?

SOLUSI

a) Mean = (18.71+21.41+20.72+21.81+19.29+22.43+20.17+23.71+19.44+20.50 +18.92+20.33+23.00+22.85+19.25+21.77+22.11 +19.77+18.04+21.12) / 20

Mean = 20.768

Median dari data = 18.04    18.71    18.92    19.25    19.29    19.44    19.77    20.17    20.33    20.50        20.72    20.77     21.12    21.41   21.77    22.11    22.43   22.85  23.00   23.71

Dari data di atas, mediannya adalah (20.50 + 20.72) / 2 –> 20.61

(b) Compute the 10% trimmed mean.

1 2 3 4 5 6 7 8 9 10
18,04 18,71 18,92 19,25 19,29 19,44 19,77 20,17 20,33 20,5 20 data
20,72 21,12 21,41 21,77 21,81 22,11 22,43 22,85 23 23,71 2 ATAS 10,00%
11 12 13 14 15 16 17 18 19 20 2 BAWAH
1 18,04 JUMLAH 16 SISA DATA
2 18,71 331,89
3 18,92
4 19,25 PEMBAGI
5 19,29 16
6 19,44
7 19,77 the 10% trimmed mean
8 20,17 20,74313
9 20,33
10 20,5
11 20,72
12 21,12
13 21,41
14 21,77
15 21,81
16 22,11
17 22,43
18 22,85
19 23
20 23,71

(c) Do a dot plot of the absorbency data.

PLOT

(d) Using only the values of the mean, median, and
trimmed mean, do you have evidence of outliers in
the data?

Terdapat perubahan nilai dari data, nilai mean yaitu 20.768 nilai median 20.61, dan nilai trim yang dipangkas 10% yaitu 20,74313

bersambung ke